Stats 5
Conducting the paired samples test
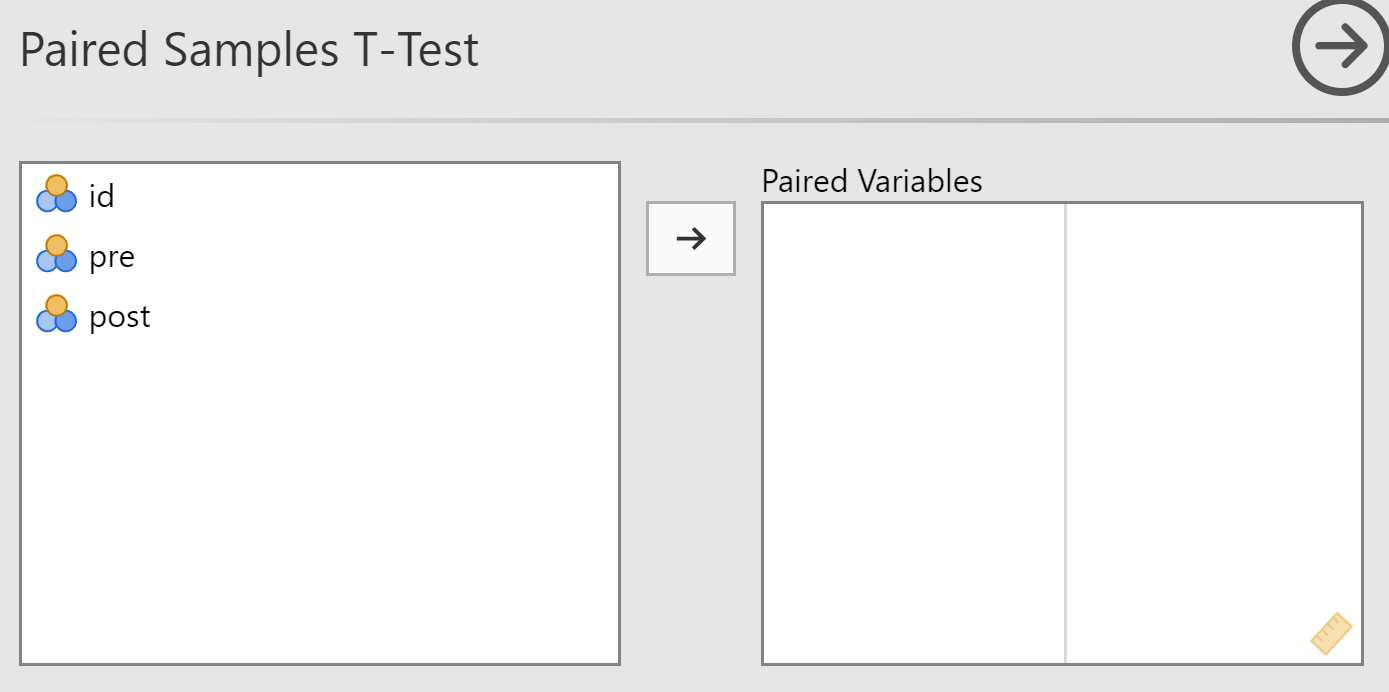
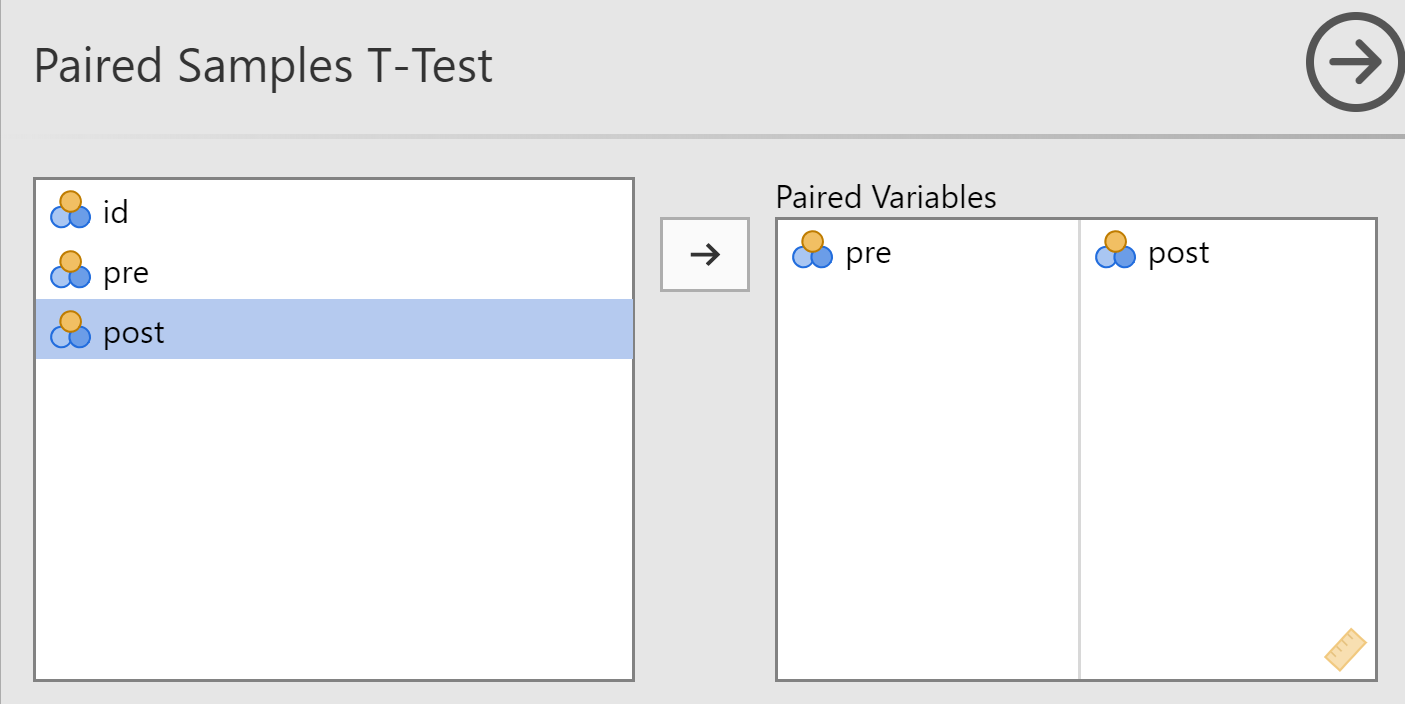
To get started, select T Tests → Paired-Samples T Test. Instead of entering the variables one at a time, you need to select a pair of variables. Click on "pre" and then, while holding down the Shift or Ctrl key, also click on "post" so that it is highlighted as well:

Then click the right-pointing arrow button in the dialog to move those variables into the first row of the "Paired Variables" box:

Under Additional Statisticts select all the options as below.
Output from Paired-Samples T Test
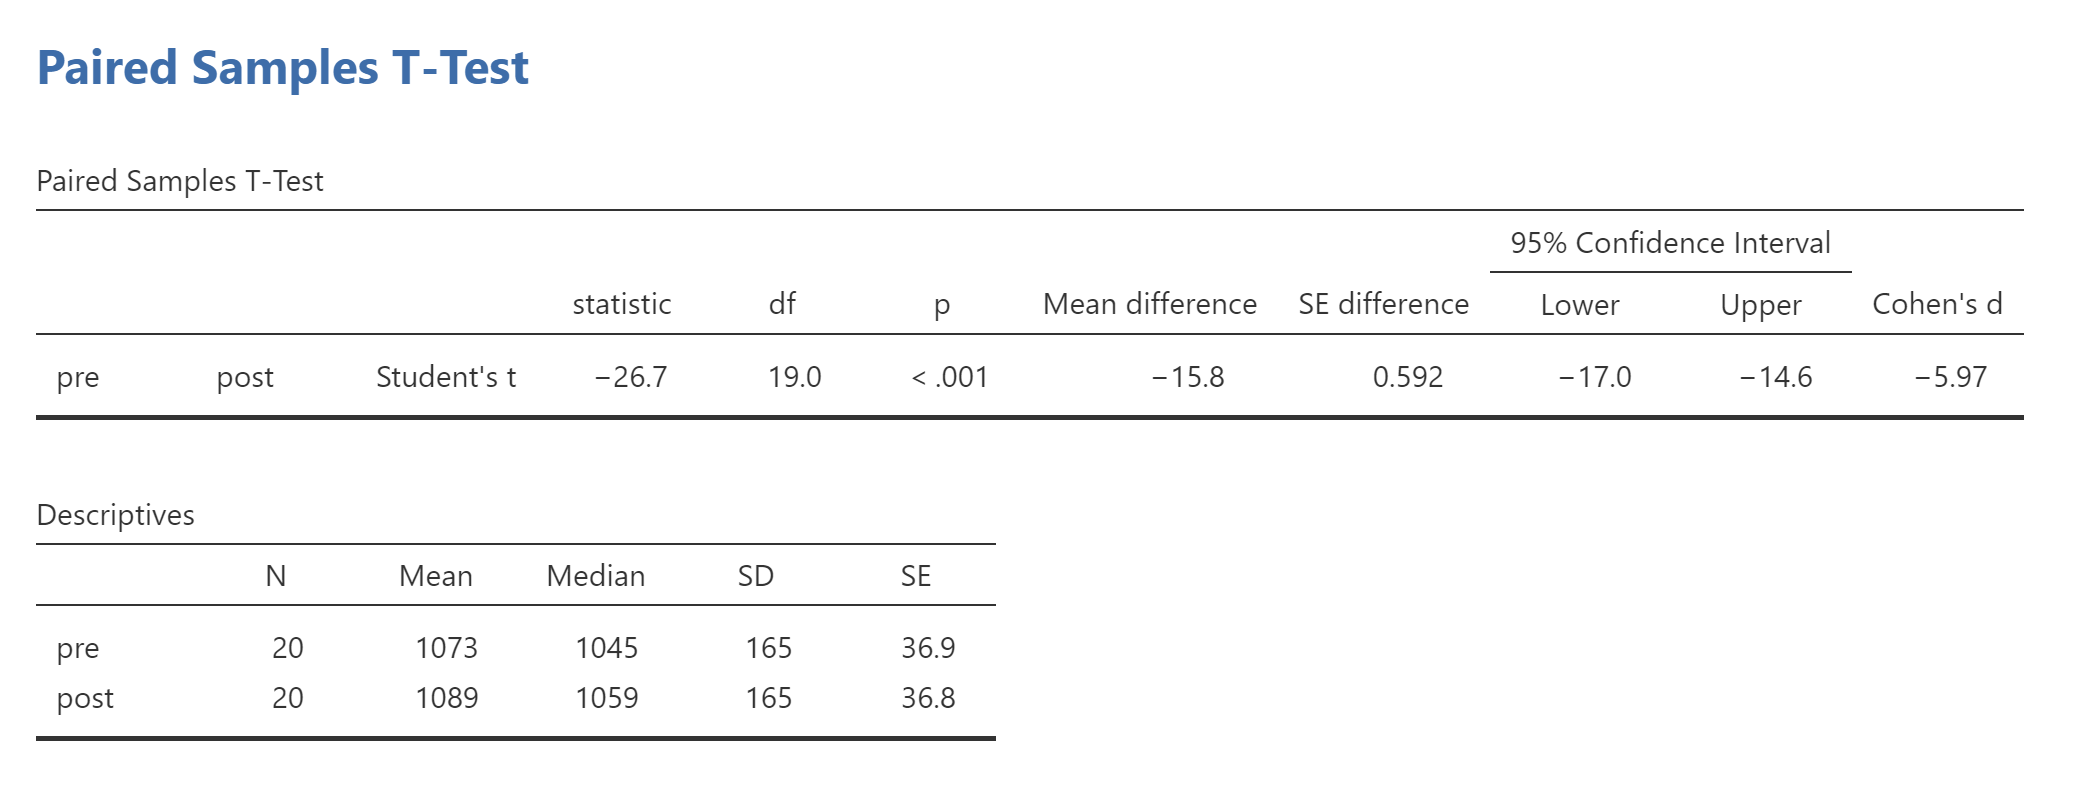
Here will be our t-test result and your descriptives

The descriptive statistics show that the mean at post-test was 1088.8, which is higher than the pre-test mean of 1073.0. It says that there were 20 people. You can skip the second portion, reporting the correlation between the variables. Finally, you get the results of the t-test itself:
The mean of the differences between pre and post is -15.8. It is negative because we subtracted post scores from pre scores, and the post-course scores were higher than the pre-course scores. You could interpret this as a 15.8-point increase from pre-course to post-course. The 95% confidence interval for that difference is -17.04 to -14.56, but remember that if both sides of the interval have the same sign, you should make them positive. Thus, the confidence interval indicates that the increase in the scores from pre to post was somewhere between 14.56 points and 17.04 points. The confidence interval tells you how precise your estimate of the difference is: You can be 95% confident that the population difference between pre-course and post-course scores is between 14.56 and 17.04 points on the GRE. Because the 95% confidence interval does not cover zero, there is less than a 5% probability that the population difference is 0. When the 95% confidence interval does not cross zero, you know that you will have a difference that is significant at p < .05, and this is supported with the obtained p-value of <.001 (in the last column, "Sig. (2-tailed)" is ".000").
To write this up in APA style, you could say:
On average, students increased their GRE scores by 15.8 points from pre-test (M = 1073.0) to post-test (M = 1088.8). The 95% confidence interval for the difference was 14.56 to 17.04 points. The increase was significant according to a dependent t-test, t(19) = 26.69, p < .001.
Homework
Log into your Moodle account for a homework exercise on correlation and dependent t-tests.