One-way ANOVA Part 2
Check the pattern of results with means and confidence intervals
We now need to examine the data directly and to do that we need a plot. Jamovi provides an easy way to get a good plot of the results, if a little obscure for students of your level of statistical knowledge.
Below the Post Hoc setting you will see Estimated Marginal Means. Estimated marginal means are very useful in complex statistical procedures that use both correlation and ANOVA combined. When it is a plane anova, the estimated marginal mean will be the same as the means for each condition. In this section, we can easily get a graph and a table of the results.
So, open this part of the dialog, drag conditoin to the "Marginal Means" box under "Term 1". Make sure both "Marginal mean Plots" and "Marginal mean Tables" are slected. Also, select "Observed Scores".
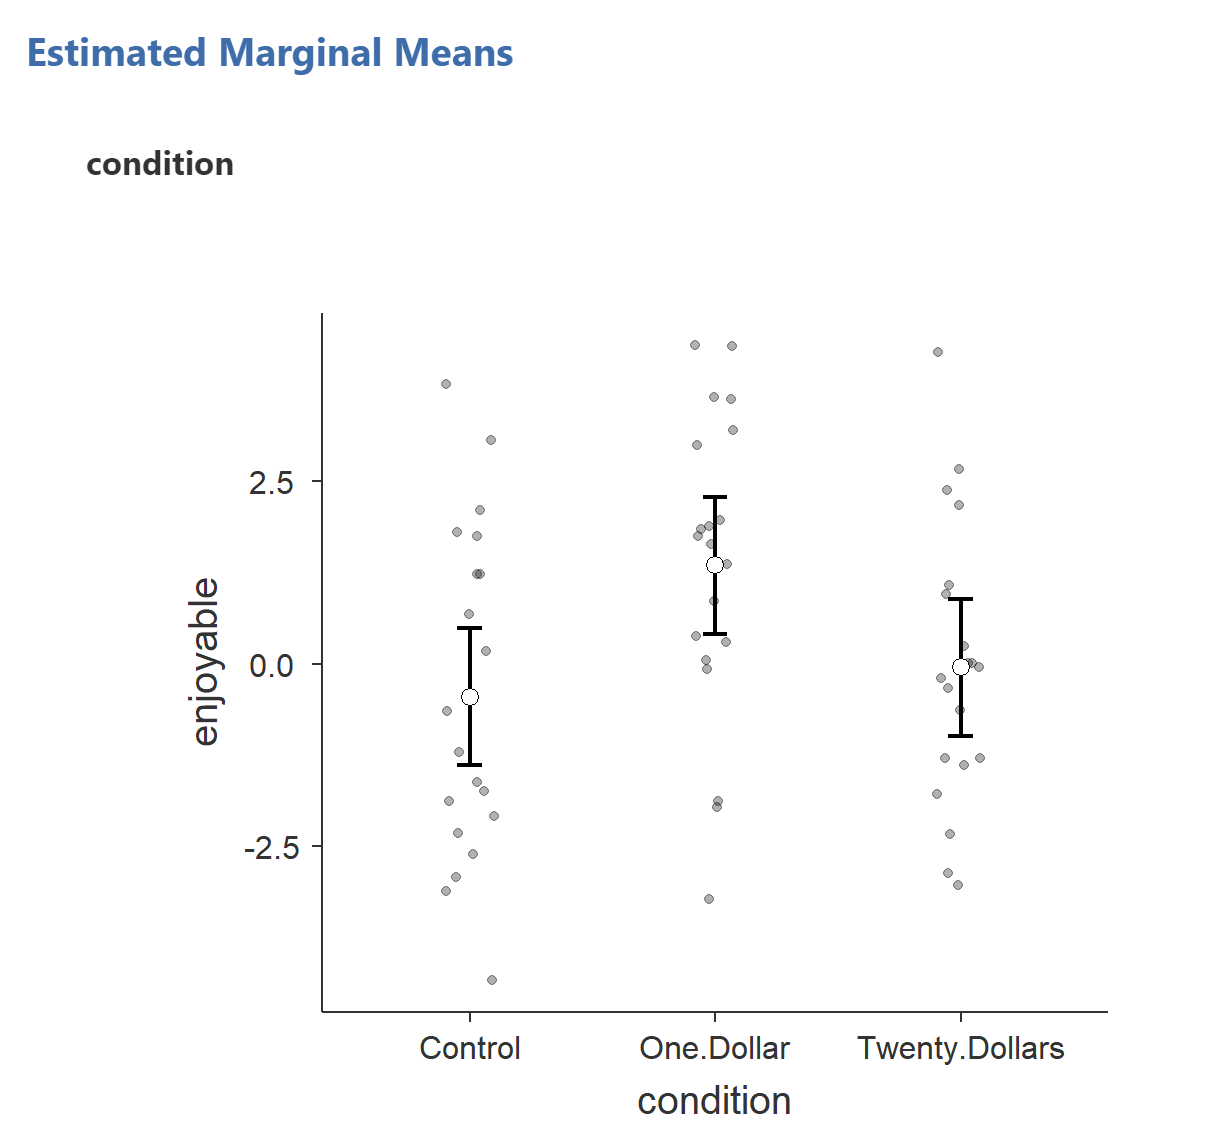
You should get somthing very similar to this:

On a -5 to +5 scale, 0 indicates a neutral response. You can see that two groups have means that are at or just below neutral: the Control group and the Twenty Dollars group. In contrast, the One Dollar group has a mean above neutral. This pattern is consistent with the researchers’ hypothesis. It would be nice to add a reference line crossing at the 0 level on the y axis to make this clearer but currently that is not possible in Jamovi.
NOTE ON GRAPHING
Okay, last time we used a bar graph and there were several caveat's to play there. Still, it is worth considering the graph here. The last data was ratio, tip percentage. This data is interval. There is no absolute 0. In this case a bar graph would be misleading to say the least. Thus, it is good practice to avoid using bar graphs with this type of data. It is also increasingly common to show the data points on graphs to convey enve more information than is seen in mean and standard errors.
APA-Style Tables
It is common with ANOVA designs to report the means, standard deviations, and results of pairwise comparisons in a table. In general, use two decimal places (see APA Publication Manual, 6th edition, pages 113-114 for more on decimals). The box below shows a typical table for comparisons of three groups. The note underneath the table explains how subscripts are used to describe the results of the Tukey HSD comparisons. For more on formatting tables, see the APA Publication Manual, chapter 5.
Table 1
Means and Standard Deviations of Responses to How Enjoyable Tasks Were, by Condition
(2.31)
(2.11)
(1.85)
Note. Standard deviations are in parentheses. Means that do not share subscripts differ by p < .05 according to Tukey’s Honestly Significant Difference.
A tutorial for how to make an APA-style table in MS Word is here. A sample Google Doc with an APA-style table can be found here.
Some notes on tables:
- Every table must be numbered, and must be referred to in the text (e.g., "As the means in Table 1 indicate...").
- The title of a table is presented below the word "Table", double-spaced, and is capitalized.
-
The subscripts presented next to the means can sometimes seem like a logic puzzle, so think through them carefully. In the table above, we show that the Control Condition is different from the One Dollar condition by giving them different subscripts, and we show that those two groups do not differ from the Twenty Dollar condition by giving the Twenty Dollar condition both subscripts.
How to Determine Subscripts
The table of post hocs show which means are sginficantly different from each other as well as those that are not. To use that information to make the subscripts:
- give an "a" subscript to Control and all means that are not significantly different (that is Twenty Dollar)
- a "b" to One Dollar and all those not significantly different from it (that is Twenty Dollar). Note that the Twenty Dollars condition will receive both an a and a b.
- continue to the second to last condition, which is One Dollar in this case.
Homework
There is a homework assignment to help you practice using one-way ANOVA on the Moodle site.