Composite Score
The goal of using several items to measure a construct is to produce a single composite score that is more reliable than any single item in your measure. In the current example, we want a single composite score for the 11 BSS items. Typically, researchers do this by computing the mean of the items. To do this in Jamovi, we will create a new computer variable dialog like we did to reverse score items. So scorll to the end of the variables and click in the top box like before and select "New Computed Variable". Give the variable a name, use "BSS" for now. In the forumula box where you wrote "8-bss07" the last time, type the word "MEAN", in uppercase, and then type an open parenthesis. Inside that parenthesis, put a comma-separated list of the variables that you want to average together:

Note that you are using the reverse-scored variables (bss02r, bss03r, and bss07r) and not their original values. Press "Enter" to compute the mean. When you’re done, look in the Data Window and scroll all the way to the right. You should see a new variable called "BSS":
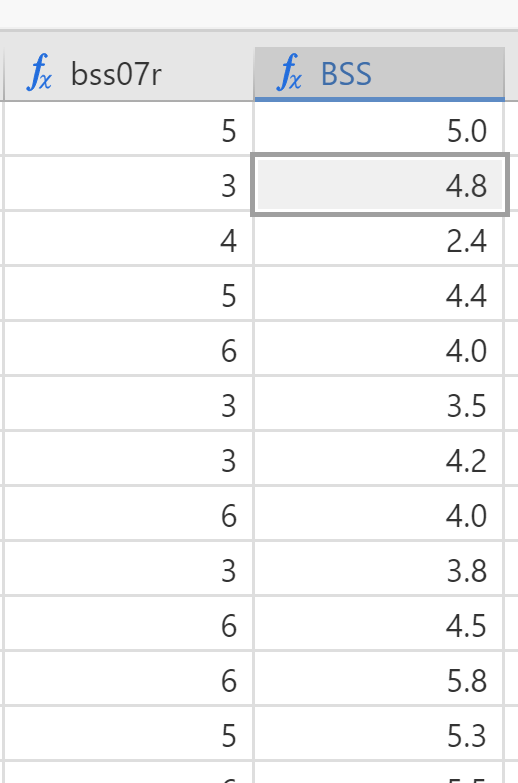
That new variable is the composite score. It is a single variable that will take the place of the 11 individual BSS items and is more reliable (has less error) than any of the original items. It’s a good idea to take a look at this new mean score to see if it has any extremely high or low values and whether it is approximately normally distributed, with most scores in the middle and fewer scores at the high and low ends. We will dow this by examing the describes statistics of the new variable. Click on the Analyses tab at the top and then Descriptives at the left end:
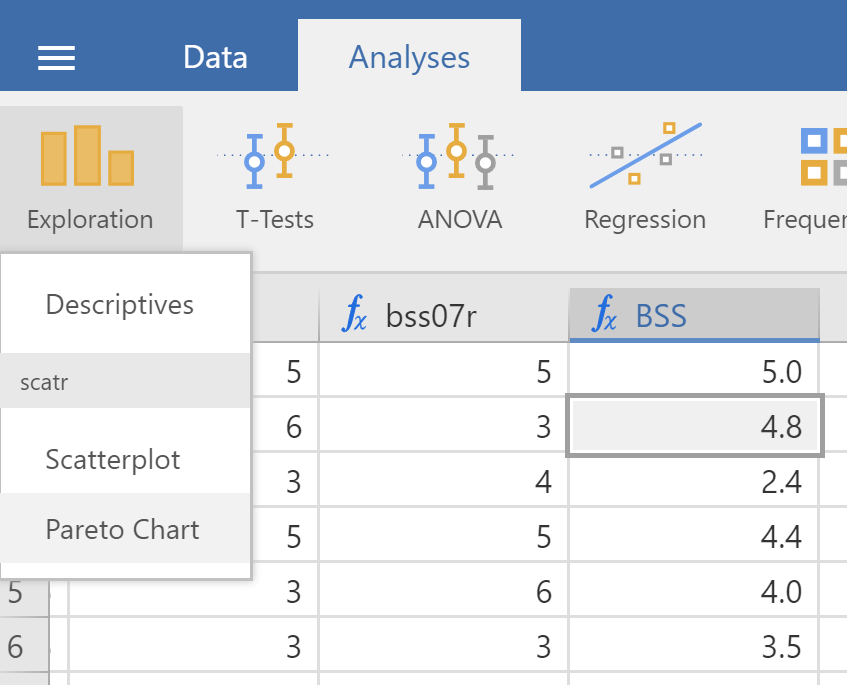
The window should now look like this:
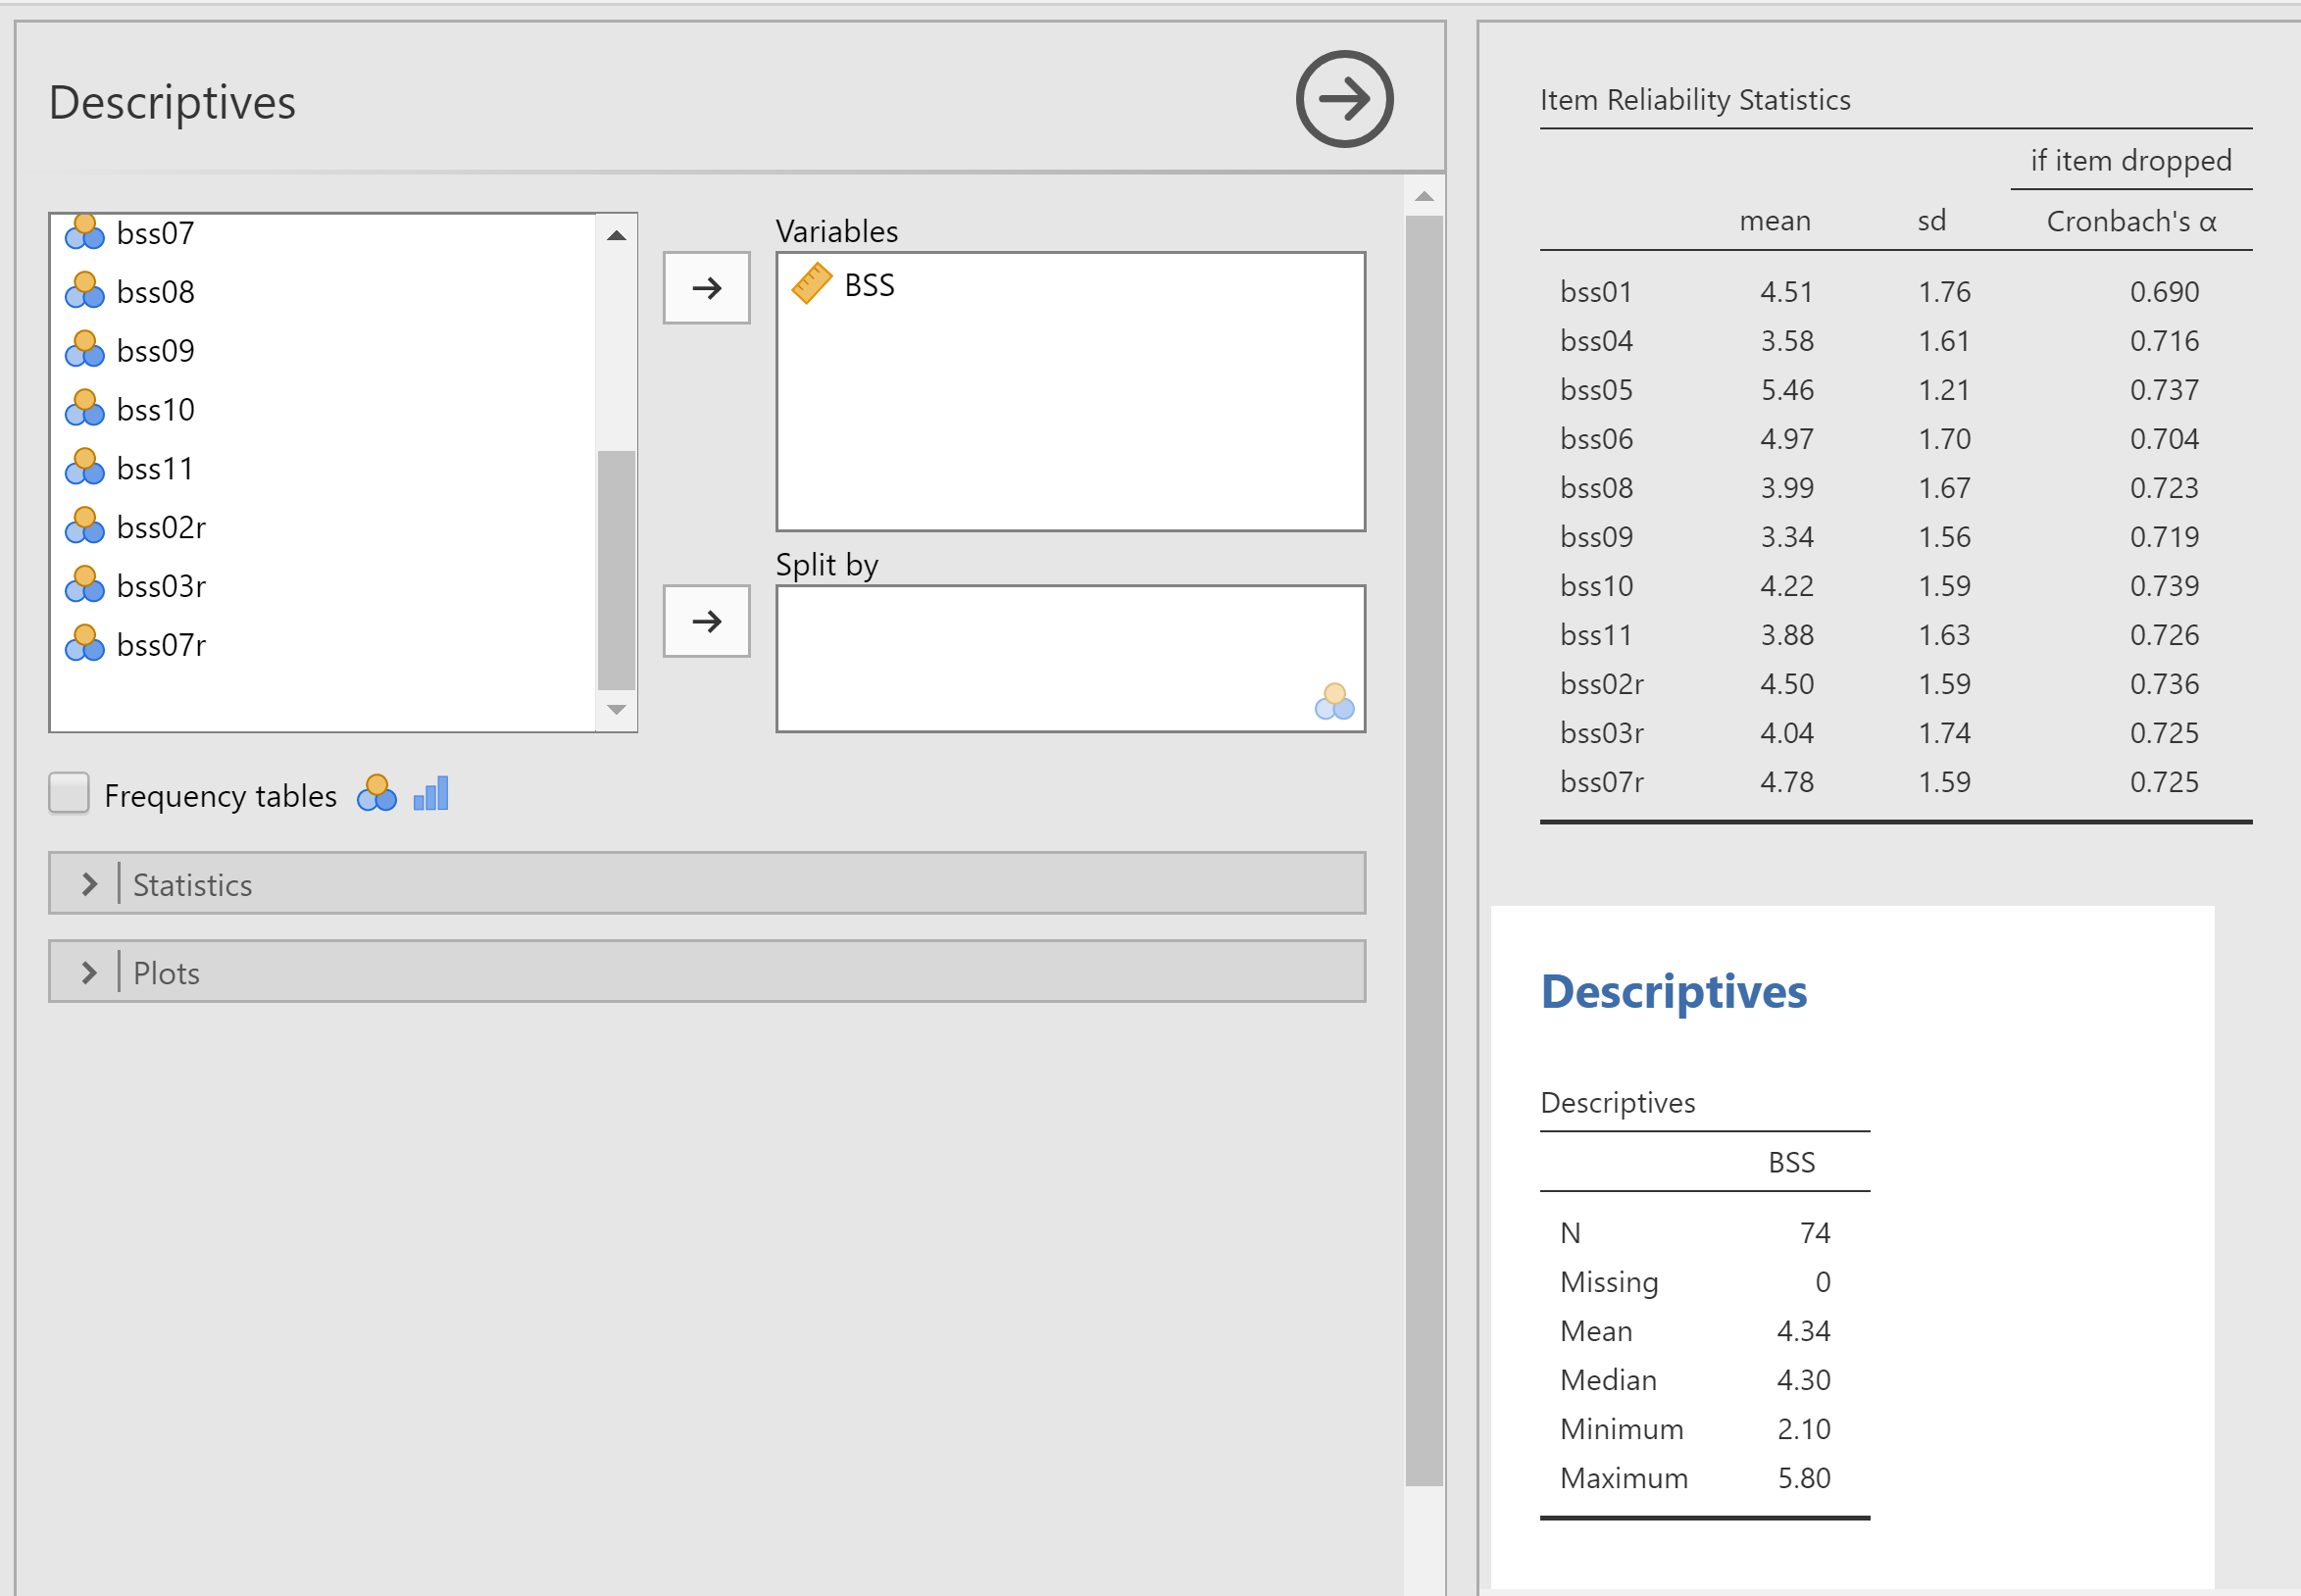
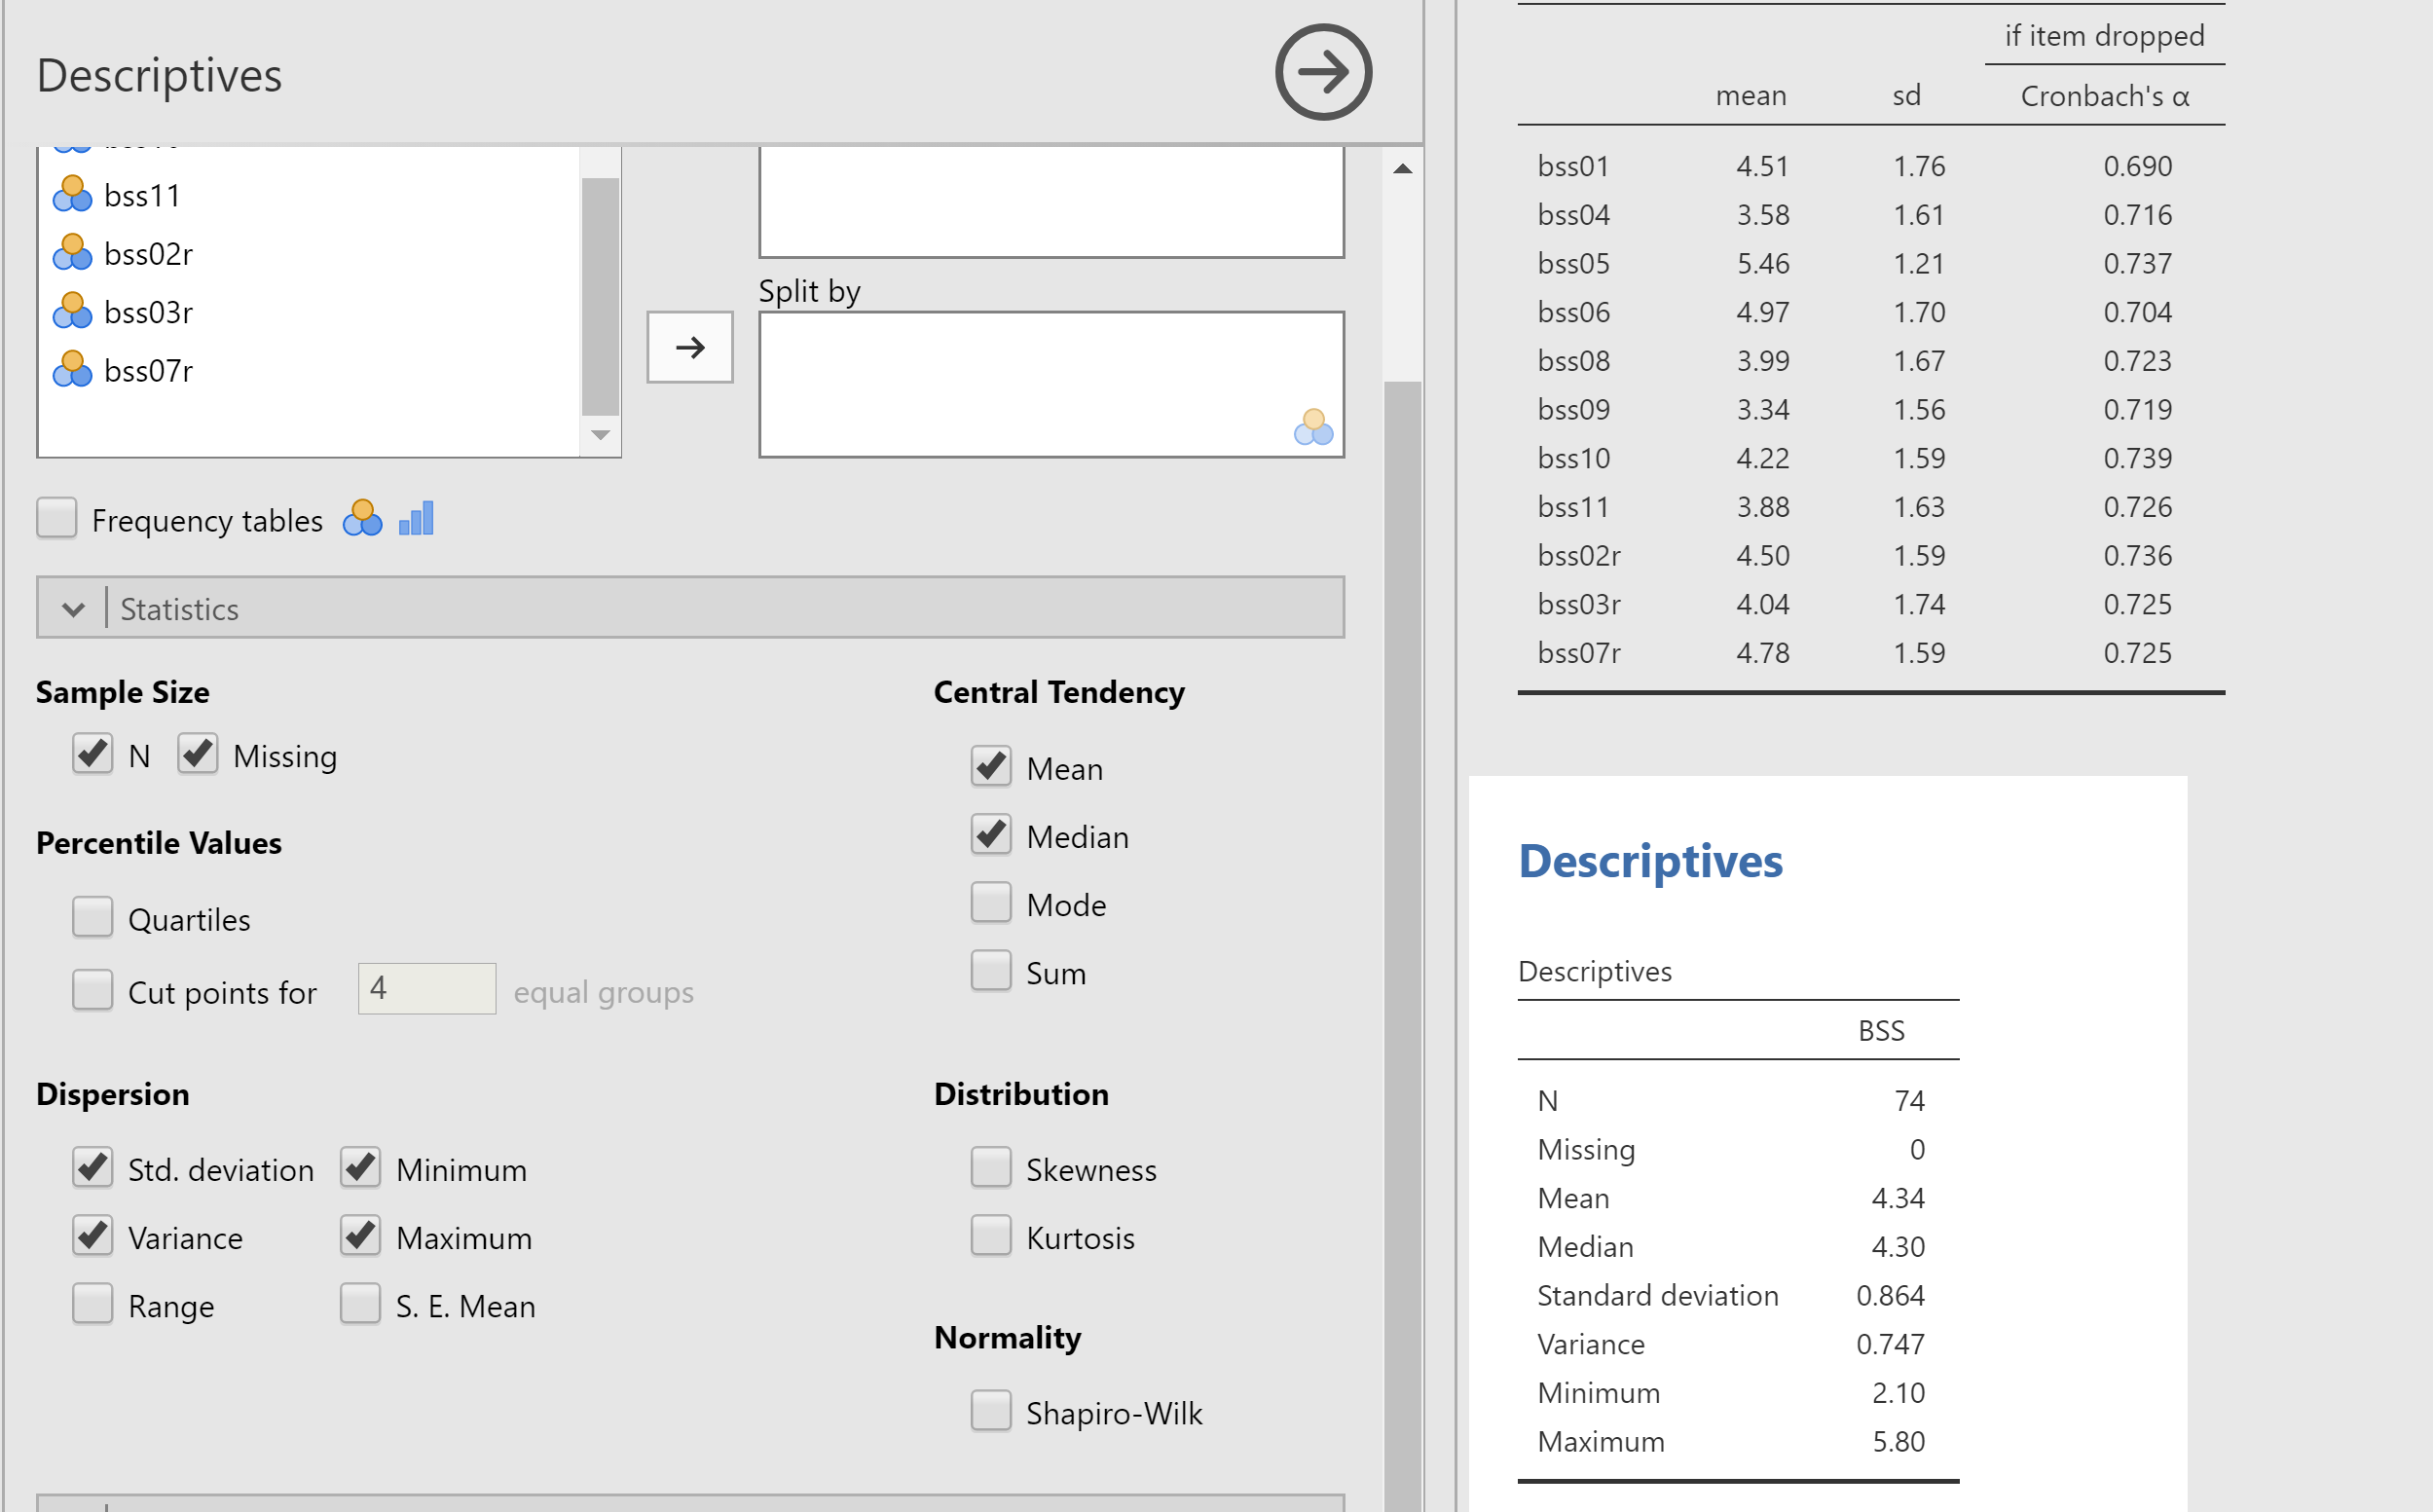
Put "BSS" into the "Variables" list and press "Enter". Then click on Statistic below the item list to expand the descriptives you can examine. You should at least at "Standard Deviation" and "Variance" under Dispersion and any other statistics you would like to exampe. You should get this:
To examind the distibution of the scores of your scale, scroll the left side of Jamovi where you set up your analysis to the bottom and click on Plots. The best one for our purposes is "Histogram". Select it.
You should get:

A histogram plots the values on the x-axis and the frequency, or what Jamovi calls "Density" on the y-axis. So the taller the bar, the more common that score occured. You would typically not report a this histogram in a research report, but it is a very good thing to look at before you begin data analysis to make sure that your variables do not have any strange values. For example, to the left, you see a few items that stand out from the rest. These are probably not an issue, but more extreme values could be. You can also see if your data is approximately normally distributed. This distrubtion is slightly skewed but not terribly. A more common element to include in a report would be the mean and standard deviation of your new variable. To get those, we’ll use descriptive statistics.
Descriptive Statistics
If you scroll back up in the output window to just above the histogram plot fot the BSS compositve variable, you will see the descriptive statistics for that variable:
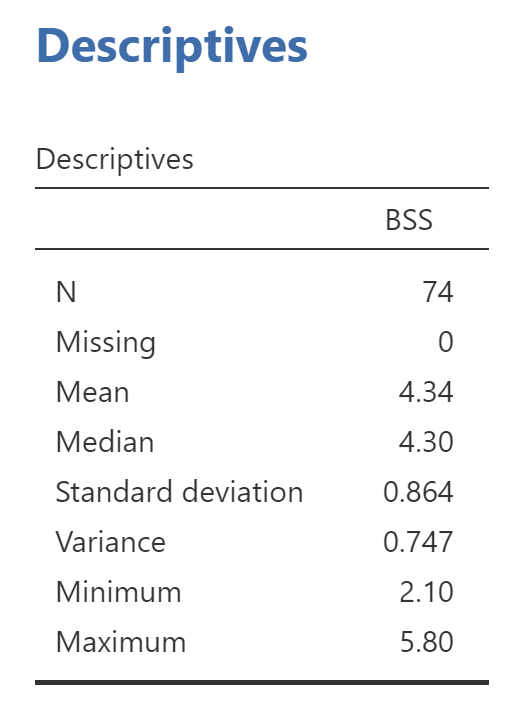
As we suspected from the histogram, the mean is slightly above 4, and the minimum and maximum scores are still within the expected 1 to 7 range. Your report of a new score should include:
- How many items went into the new score (11 in this case).
- How the item values were combined (mean, sum, etc.).
- The Cronbach’s alpha reliability.
- The minimum, maximum, mean, and standard deviation of the scores.
- An interpretation of high scores. Look back at the items from the BSS to see what high and low scores indicate. Think about how you could describe the beliefs of a person who agrees with items 1, 4, 5, 6, 8, 9, 10, 11, and who disagrees with 2, 3, and 7.
For example:
A Benevolent Sexism Scale (BSS) score was computed for each participant by taking the mean of the 11 items of the Benevolent Sexism Scale after reverse-scoring the appropriate items. The Cronbach's alpha reliability of the BSS was 0.74. BSS scores ranged from 2.00 to 5.82, with a mean of 4.30 and standard deviation of 0.85. High scores on the BSS indicate that a person believes that men should protect women, that men need women, or that women have positive qualities that men lack.
There is a 5-question stats homework assignment on reliability analysis that accompanies this tutorial. To begin the assignment, you can log in to your moodle account for this course and select the "Stats 2: Reliability Analysis" quiz.