Acuity and Retinal Location Lab


Background:

  1. Purpose and Goals
    1. to measure and see how acuity deteriorates as the stimulus is moved farther from the fovea
    2. to develop some understanding of what is an experiment
    3. To begin to learn how to design an experiment to answer a question
    4. to compare data to hypothesis
  2. Acuity and Retinal Physiology
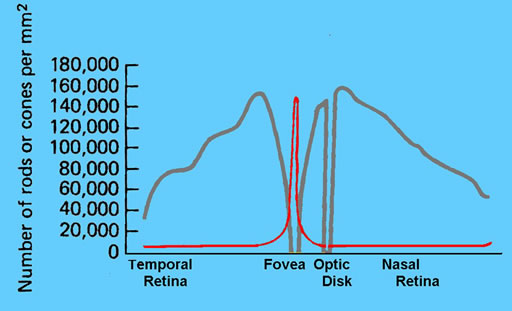
    1. From class and chapter 3 of the text, we learn that the number of cones get fewer as the distance from the fovea increases.
      Recector Density across retina
    2. Observations:
      1. Since we will be testing in the day time, it is the cones that are the principal receptors involved in what we see
      2. The density of cones is by far the greatest in the fovea
      3. It has also been observed that receptive fields are smaller at the fovea than in the periphery
      4. Acuity and receptive fields are examples of spatial summation so should be linked
    3. Question: It would seem that if the density of the cones is greatest in the fovea and the receptive fields are smallest in the fovea that our acuity would be highest at the fovea and decrease in the periphery.
  3. Experiments
    1. Scientist use many types of methods to collect their data.
    2. One type of research method unique to the sciences is the experiment.
    3. In simple terms that means the research changes something and sees what happens.  I will introduce a lot of formal language, but that is the basic idea, hold onto it.
    4. The thing that the experimenter changes is called the Independent Variable (IV).
    5. The thing that the experimenter measures to see what happened is the dependent variable (DV)
    6. See if you can figure out the IV and DV for this experiment.

The Experiment: Motion Thresholds

  1. Stimulus Settings: Note all values
    1. Stimulus Type: Checkerboard
    2. Contrast: Leave unchanged but note for your stimulus section
    3. Stimulus Position: in your groups you will pick both number of positions and where
      1. What you want:
        • To cover the possible range
        • To determine how acuity changes over range
        • Pick at least 3.
      2. Issues to Consider:
        • Too few levels will not allow you to know what is going on in your data
        • Too many will cause unnecessary wear and tear on your participants
        • The goal is good clear data with as few measures as necessary
    4. Background Level: Leave unchanged
  2. Method Settings (this is Method of Limits): Note all values
    1. Number of Levels of Critical Feature Size: You pick in your groups
      1. too few and you will not have a good measure of the threshold
      2. Too many and you bore and tire your participants which can lead to sloppy responses
      3. The goal is clear, accurate measures
    2. Number of staircases: Same Issues as above
    3. Minimum Value of Critical Feature Size: Lowest value in staircases
      1. Set to 1.
    4. Maximum Value of Critical Feature Size: Largest value in staircases
      1. Set to 10.
  3. Procedure:
    1. Every member of the group should use the same browser this week and next.
    2. Make the browser fill the screen.
    3. Place your head centered on the screen 24" from the monitor surface.
    4. Fixate on the red fixation mark.  Do not move your eyes from that spot.
    5. The stimulus will be presented at the position you chose for this condition. 
    6. If you see it, press the yes button or the z key.
    7. If you do not see it, press the no button or the / key.
    8. The threshold is calculated at the end of the experiment.
    9. Press the Show Threshold button to display the threshold and then record your results.
      1. Remember how the threshold is calculated
    10. We will add a new wrinkle in the next lab.
    11. Here is the link to the lab.
  4. Write-up: (Method, Results, Summary)
    1. Week 1:
      1. Nothing Due
    2. Week 2: Graphing Results with Error Bars
      1. Do a graph of your results to hand in on Moodle. 
      2. Your graph should be and x-y scatter plot with points connected by straight line connectors
      3. Put error bars around mean values.
    3. Week 3: Abbreviated Lab Report with the following sections:
      1. Method: Your method must include the following subsections:
        • Participants:  A brief description of who was in your experiment.  You need data from all members of your group
        • Stimulus: A description of all stimuli used and your calibration
        • Equipment: What equipment you used
        • Procedure: How you collected the data
      2. Results: a description of your findings
        • Use your data and the data from the other member(s) of your group.
      3. Summary: Do your results match your expectations, listed at the beginning of this page